Microsoft Power BI | Tableau | Data Visualization

Admin: @coderfun

Web3 platform that empowers users with seamless earning opportunities. Our mission is to make life changing rewards accessible to everyone in just minutes a day
Play🕹️: @realyescoinbot
Business: @advertize_support
Last updated 1 year, 8 months ago

Fast transfers & trading, send meme gifts 🎁 and earn 100x returns — fun and flexible crypto app!
Incubated & invested by Binance Labs

Https://grandjourney.io
Last updated 1 year, 9 months ago
Power BI vs Tableau: Which BI Tool is Right for You?
Ease of Use – Power BI is more beginner-friendly, especially for those familiar with Excel, while Tableau requires a steeper learning curve but offers advanced customization.
Pricing – Power BI is more affordable, making it ideal for small businesses, whereas Tableau is costlier but provides robust enterprise-level features.
Data Connectivity – Both tools support various data sources, but Tableau offers broader and deeper connectivity options for large-scale data analytics.
Visualization & Customization – Tableau excels in advanced visualizations and design flexibility, whereas Power BI provides a simpler drag-and-drop interface with strong AI-driven insights.
Performance & Speed – Tableau handles large datasets more efficiently, whereas Power BI can slow down with very complex models unless optimized.
Integration – Power BI integrates seamlessly with Microsoft products (Excel, Azure, Power Apps), while Tableau connects well with multiple platforms, including cloud services.
Community & Support – Tableau has a strong user community for data visualization, while Power BI benefits from Microsoft’s extensive support and frequent updates.
Complete Roadmap to learn Power BI 👇*👇***
Step 1: Power BI Basics
1. Understand the Power BI ecosystem, including Power BI Desktop and Power BI Service.
2. Learn to import data from different sources (Excel, SQL Server, CSV, etc.).
3. Explore Power Query Editor for data transformation and cleaning.
4. Practice creating basic visualizations like bar charts, line charts, and pie charts.
Step 2: Intermediate Power BI
1. Dive deeper into data modeling concepts such as relationships, calculated columns, and
measures.
2. Learn about DAX (Data Analysis Expressions) for advanced calculations and
aggregations.
3. Explore Power BI visuals and custom visuals for enhanced data visualization.
4. Practice creating interactive dashboards and reports with slicers, filters, and drill-down
features.
Step 3: Advanced Power BI
1. Master advanced data modeling techniques like role-playing dimensions and
many-to-many relationships.
2. Learn about Power BI Service features such as workspaces, datasets, and dataflows.
3. Explore Power BI administration and security settings.
4. Practice optimizing performance and refreshing data in Power BI reports.
I have curated the best interview resources to crack Power BI Interviews 👇👇
https://whatsapp.com/channel/0029Vai1xKf1dAvuk6s1v22c
Hope you'll like it
Like this post if you need more resources like this 👍❤️

𝗙𝗥𝗘𝗘 𝗖𝗼𝘂𝗿𝘀𝗲𝘀 𝘁𝗼 𝗠𝗮𝘀𝘁𝗲𝗿 𝗗𝗮𝘁𝗮 𝗦𝗰𝗶𝗲𝗻𝗰𝗲 & 𝗔𝗜!😍
Want to boost your career with in-demand skills like 𝗗𝗮𝘁𝗮 𝗦𝗰𝗶𝗲𝗻𝗰𝗲, 𝗔𝗜, 𝗠𝗮𝗰𝗵𝗶𝗻𝗲 𝗟𝗲𝗮𝗿𝗻𝗶𝗻𝗴, 𝗣𝘆𝘁𝗵𝗼𝗻, 𝗮𝗻𝗱 𝗦𝗤𝗟?📊
These 𝗙𝗥𝗘𝗘 𝗖𝗼𝘂𝗿𝘀𝗲𝘀 provide hands-on learning with interactive labs and certifications 𝗖𝗲𝗿𝘁𝗶𝗳𝗶𝗰𝗮𝘁𝗶𝗼𝗻𝘀 to enhance your 𝗥𝗲𝘀𝘂𝗺𝗲📍
𝐋𝐢𝐧𝐤👇:-
Perfect for beginners & professionals looking to upgrade their expertise—taught by industry experts!✅️
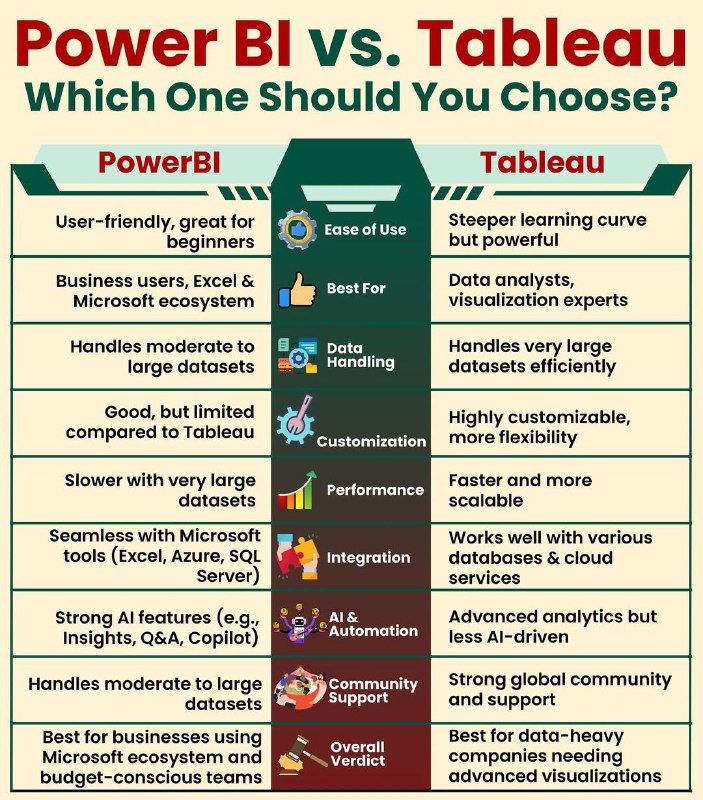
Power BI vs Tableau ✅
Tableau Cheat Sheet ✅
This Tableau cheatsheet is designed to be your quick reference guide for data visualization and analysis using Tableau. Whether you’re a beginner learning the basics or an experienced user looking for a handy resource, this cheatsheet covers essential topics.
-
Connecting to Data
- Use Connect pane to connect to various data sources (Excel, SQL Server, Text files, etc.). -
Data Preparation
- Data Interpreter: Clean data automatically using the Data Interpreter.
- Join Data: Combine data from multiple tables using joins (Inner, Left, Right, Outer).
- Union Data: Stack data from multiple tables with the same structure. -
Creating Views
- Drag & Drop: Drag fields from the Data pane onto Rows, Columns, or Marks to create visualizations.
- Show Me: Use the Show Me panel to select different visualization types. -
Types of Visualizations
- Bar Chart: Compare values across categories.
- Line Chart: Display trends over time.
- Pie Chart: Show proportions of a whole (use sparingly).
- Map: Visualize geographic data.
- Scatter Plot: Show relationships between two variables. -
Filters
- Dimension Filters: Filter data based on categorical values.
- Measure Filters: Filter data based on numerical values.
- Context Filters: Set a context for other filters to improve performance. -
Calculated Fields
- Create calculated fields to derive new data:
- Example:Sales Growth = SUM([Sales]) \- SUM([Previous Sales]) -
Parameters
- Use parameters to allow user input and control measures dynamically. -
Formatting
- Format fonts, colors, borders, and lines using the Format pane for better visual appeal. -
Dashboards
- Combine multiple sheets into a dashboard using the Dashboard tab.
- Use dashboard actions (filter, highlight, URL) to create interactivity. -
Story Points
- Create a story to guide users through insights with narrative and visualizations. -
Publishing & Sharing
- Publish dashboards to Tableau Server or Tableau Online for sharing and collaboration. -
Export Options
- Export to PDF or image for offline use. -
Keyboard Shortcuts
- Show/Hide Sidebar:Ctrl+Alt+T
- Duplicate Sheet:Ctrl + D
- Undo:Ctrl + Z
- Redo:Ctrl + Y -
Performance Optimization
- Use extracts instead of live connections for faster performance.
- Optimize calculations and filters to improve dashboard loading times.
Free Resources: https://whatsapp.com/channel/0029Vai1xKf1dAvuk6s1v22c
Hope you'll like it
Share with credits: https://t.me/sqlspecialist
Hope it helps :)

𝗕𝗼𝗼𝘀𝘁 𝗬𝗼𝘂𝗿 𝗖𝗮𝗿𝗲𝗲𝗿 𝘄𝗶𝘁𝗵 𝗙𝗥𝗘𝗘 𝗖𝗶𝘀𝗰𝗼 𝗣𝗿𝗼𝗳𝗲𝘀𝘀𝗶𝗼𝗻𝗮𝗹 𝗦𝗸𝗶𝗹𝗹𝘀 𝗖𝗼𝘂𝗿𝘀𝗲𝘀!😍
Want to stand out in the tech industry? 🌟
🔥Cisco offers FREE courses to help you develop career-ready skills like:
𝐋𝐢𝐧𝐤👇:-
Don’t miss this opportunity! Start learning now✅
Top 15 advanced Power BI interview questions
-
Explain the concept of row-level security in Power BI and how to implement it.
-
What are calculated tables in Power BI, and when would you use them?
-
Describe the differences between DirectQuery, Live Connection, and Import Data storage modes in Power BI.
-
How can you optimize the performance of a Power BI report or dashboard with large datasets?
-
What is the DAX language, and how is it used in Power BI? Provide an example of a complex DAX calculation.
-
Explain the role of Power Query in data transformation within Power BI. What are some common data cleansing techniques in Power Query?
-
What is the purpose of the Power BI Data Model, and how do relationships between tables impact report development?
-
How can you create custom visuals or extensions in Power BI? Provide an example of when you would use custom visuals.
-
Describe the steps involved in setting up Power BI Gateway and its significance in a corporate environment.
-
What are the differences between Power BI Desktop, Power BI Service, and Power BI Mobile? How do they work together in a typical Power BI workflow?
-
Discuss the process of incremental data refresh in Power BI and its benefits.
-
How can you implement dynamic security roles in Power BI, and why might you need them in a multi-user environment?
-
What are Power BI paginated reports, and when would you choose to use them over standard interactive reports?
-
Explain the concept of drill-through in Power BI, including its configuration and use cases.
-
How can you integrate Power BI with other Microsoft products, such as Azure Data Lake Storage or SharePoint?
Power BI Resources 👇👇
https://whatsapp.com/channel/0029Vai1xKf1dAvuk6s1v22c
Hope you'll like it
Like this post if you need more resources like this 👍❤️

𝟰 𝗔𝗜 𝗖𝗲𝗿𝘁𝗶𝗳𝗶𝗰𝗮𝘁𝗶𝗼𝗻𝘀 𝘁𝗼 𝗕𝗼𝗼𝘀𝘁 𝗬𝗼𝘂𝗿 𝗖𝗮𝗿𝗲𝗲𝗿 𝗶𝗻 𝗔𝗜 𝗗𝗲𝘃𝗲𝗹𝗼𝗽𝗺𝗲𝗻𝘁!😍
Want to stand out as an AI developer?✨️
These 4 AI certifications will help you build expertise, understand AI ethics, and develop impactful solutions! 💡🤖
𝐋𝐢𝐧𝐤👇:-
Perfect for Beginners & Developers Looking to Upskill!✅️
When preparing for a Power BI interview, you should be ready to answer questions that assess your practical experience, understanding of Power BI’s features, and ability to solve real-world business problems using Power BI. Here are some key questions you might encounter, along with tips on how to answer them:
-
Can you describe a Power BI project you worked on? What was your role?
- Tip: Provide a detailed overview of the project, including the business problem, your role in the project, the data sources used, key metrics tracked, and the overall impact of the project. Focus on how you contributed to the project’s success. -
How do you approach designing a dashboard in Power BI?
- Tip: Explain your process, from understanding the user’s requirements to planning the layout, choosing appropriate visuals, ensuring data accuracy, and focusing on user experience. Mention how you ensure the dashboard is both insightful and easy to use. -
What are the challenges you’ve faced while working on Power BI projects, and how did you overcome them?
- Tip: Discuss specific challenges like data integration issues, performance optimization, or dealing with complex DAX calculations. Emphasize how you identified the issue and the steps you took to resolve it. -
How do you manage large datasets in Power BI to ensure optimal performance?
- Tip: Talk about techniques like using DirectQuery, aggregations, optimizing data models, using measures instead of calculated columns, and leveraging Power BI’s performance analyzer to optimize the performance of reports. -
How do you handle data security in Power BI?
- Tip: Discuss your experience with implementing row-level security (RLS), managing permissions, and ensuring sensitive data is protected. Mention any experience you have with setting up role-based access controls. -
Can you explain how you use DAX in Power BI to create complex calculations?
- Tip: Provide examples of DAX formulas you’ve written to solve specific business problems. Discuss the logic behind the calculations and how they were used in your reports or dashboards. -
How do you integrate Power BI with other tools or systems?
- Tip: Talk about your experience integrating Power BI with databases (like SQL Server), Excel, SharePoint, or using APIs to pull in data. Also, mention how you might export data or reports to other tools like Excel or PowerPoint. -
Describe a situation where you used Power BI to provide insights that led to a significant business decision.
- Tip: Share a specific example where your Power BI report or dashboard uncovered insights that impacted the business. Focus on the outcome and how your analysis influenced the decision-making process. -
How do you stay updated with new features and updates in Power BI?
- Tip: Mention resources you use like Microsoft’s Power BI blog, community forums, attending webinars, or taking courses. Emphasize the importance of continuous learning in your role. -
What is your approach to troubleshooting a Power BI report that isn’t working as expected?
- Tip: Describe a systematic approach to identifying the root cause, whether it’s related to data refresh issues, incorrect DAX formulas, or visualization problems. -
Can you walk us through how you set up and manage Power BI dataflows?
- Tip: Explain the process of creating dataflows, how you configure them to transform and clean data, and how they help in centralizing and reusing data across multiple reports. -
How do you handle version control and collaboration in Power BI?
- Tip: Discuss how you use tools like OneDrive, SharePoint, or Power BI Service for version control, and how you collaborate with other team members on reports and dashboards.
I have curated the best interview resources to learn Power BI
👇👇
https://whatsapp.com/channel/0029Vai1xKf1dAvuk6s1v22c
Hope you'll like it
Like this post if you need more content like this 👍❤️
Share with credits: https://t.me/sqlspecialist
Hope it helps :)
Web3 platform that empowers users with seamless earning opportunities. Our mission is to make life changing rewards accessible to everyone in just minutes a day
Play🕹️: @realyescoinbot
Business: @advertize_support
Last updated 1 year, 8 months ago
Fast transfers & trading, send meme gifts 🎁 and earn 100x returns — fun and flexible crypto app!
Incubated & invested by Binance Labs
Https://grandjourney.io
Last updated 1 year, 9 months ago