Muhammad Nabiev
Admin: @topG_02
Community chat: https://t.me/hamster_kombat_chat_2
Website: https://hamster.network
Twitter: x.com/hamster_kombat
YouTube: https://www.youtube.com/@HamsterKombat_Official
Bot: https://t.me/hamster_kombat_bot
Last updated 11 months, 3 weeks ago
Your easy, fun crypto trading app for buying and trading any crypto on the market.
📱 App: @Blum
🤖 Trading Bot: @BlumCryptoTradingBot
🆘 Help: @BlumSupport
💬 Chat: @BlumCrypto_Chat
Last updated 1 year, 5 months ago
Turn your endless taps into a financial tool.
Join @tapswap_bot
Collaboration - @taping_Guru
Last updated 1 year ago
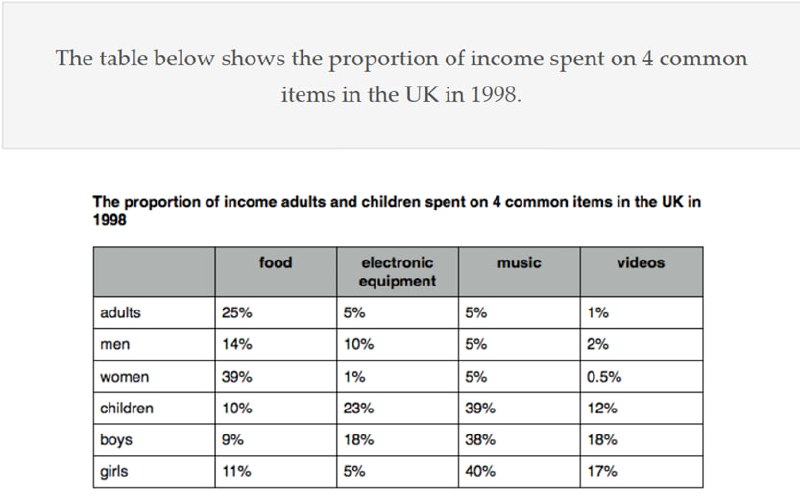
The table illustrates the proportion of income spent on four specific items—food, electronic equipment, music, and videos—in the UK in 1998.
Overall, while the highest expenditure on music occurred for girls, the lowest spending was observed for women on videos. It is also worth noting that adults, men, and women spent a similar proportion of their income on music.
The proportion of income spent on the items varied noticeably for adults, men, and women, except for music, where the percentage was the same for all groups, at 5%. Adults allocated the highest percentage of their income to food, spending 25%, followed by women at 39%. Men, however, spent 14% of their income on food. On electronic equipment, men spent 10% of their income, which was double the amount adults spent. Only 1% of women’s income went toward electronic equipment. As for videos, adults allocated just 1% of their income, while men spent twice as much, 2%. The smallest proportion of income spent on videos was among women, who spent only 0.5%.
There was a stark contrast between the proportion of income spent by children, boys, and girls compared to adults, men, and women. Girls allocated the highest proportion of their income to music, with 40%, followed by children at 39% and boys at 38%. Similarly, although 23% of children's income was spent on electronic equipment, the figure for boys was nearly half of that, at 18%. Spending on videos followed a similar trend, with children spending 12%, boys 18%, and girls 17%. The proportion of income spent on food was relatively consistent across all groups, varying by only 1%.
271 words.

Ready for round 3?
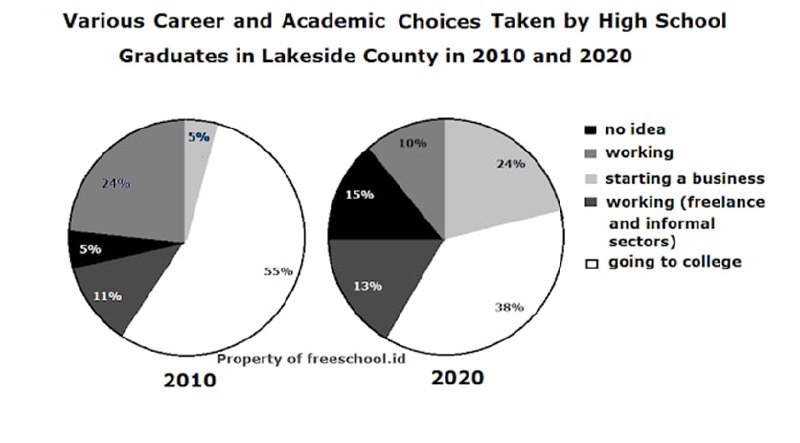
The pie charts compare different career and academic choices opted for by high school graduates in Lakeside Country between 2010 and 2020.
Overall, despite the fact that the proportion of graduates going to college decreased over a decade, it still remained the most popular choice. It is also worth mentioning that the percentage of students who chose to start a business almost tripled, accounting for the biggest growth among all other options.
The percentage of high school graduates who chose working (freelance and informal sectors) and those who were undecided grew, albeit to varying degrees. In more detail, the option with the least change was working (freelance and informal sectors), which increased by 2% from 11% in 2010 to 13% in 2020. The number of graduates who were undecided grew from 5% to 15% in 2010 and 2020, respectively, making up a twofold increase. Furthermore, the most noticeable change was in the percentage of graduates who started a business, which increased by 21%.
As for the downward trend, the percentage of graduates who chose working in 2010 was 24%, but this percentage fell to 10% in 2020. Similarly, in 2010, 55% of high school graduates preferred pursuing a college degree; however, the percentage saw a considerable decrease of 17 percentage points, dropping to 38% in 2020.
216 words.

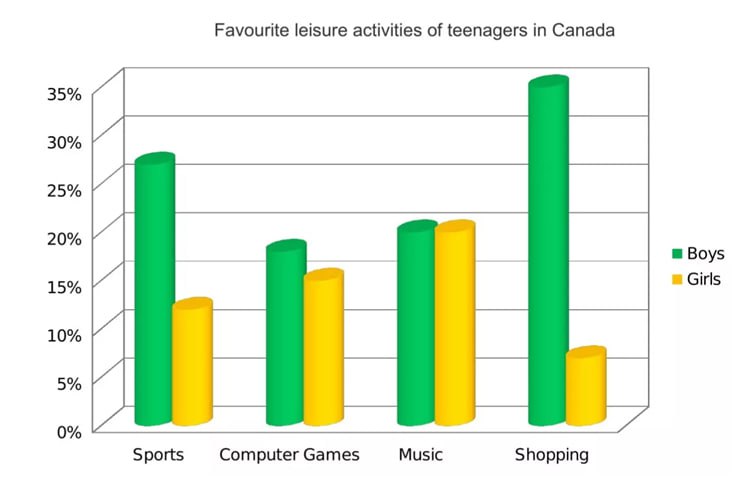
There is a comparison between boys and girls in terms of favorite pastime activites in Canada.
Overall, boys dominate in almost all activities but music, where the proportions are similar. It is noteworthy that shopping is the most popular activity among boys, while it is the least preferred by girls.
The percentages of teenagers involved in computer games and music are nearly similar. Specifically, less than 20% of both boys and girls are engaged in music. However, the proportion of those who play computer games is slightly lower, at approximately 17% for boys and 14% for girls.
There is a significant disparity between boys and girls in sports and shopping. While only about 10% of girls enjoy sports, the figure for boys is over 25%, more than double that of girls. Boys show the highest interest in shopping among all activities, at nearly 35%. In contrast, shopping is the least popular activity for girls, accounting for just about 5%.
158 words.

Community chat: https://t.me/hamster_kombat_chat_2
Website: https://hamster.network
Twitter: x.com/hamster_kombat
YouTube: https://www.youtube.com/@HamsterKombat_Official
Bot: https://t.me/hamster_kombat_bot
Last updated 11 months, 3 weeks ago
Your easy, fun crypto trading app for buying and trading any crypto on the market.
📱 App: @Blum
🤖 Trading Bot: @BlumCryptoTradingBot
🆘 Help: @BlumSupport
💬 Chat: @BlumCrypto_Chat
Last updated 1 year, 5 months ago
Turn your endless taps into a financial tool.
Join @tapswap_bot
Collaboration - @taping_Guru
Last updated 1 year ago