Tableau's Viz of the Day
Community chat: https://t.me/hamster_kombat_chat_2
Website: https://hamster.network
Twitter: x.com/hamster_kombat
YouTube: https://www.youtube.com/@HamsterKombat_Official
Bot: https://t.me/hamster_kombat_bot
Last updated 11 months, 1 week ago
Your easy, fun crypto trading app for buying and trading any crypto on the market.
📱 App: @Blum
🤖 Trading Bot: @BlumCryptoTradingBot
🆘 Help: @BlumSupport
💬 Chat: @BlumCrypto_Chat
Last updated 1 year, 4 months ago
Turn your endless taps into a financial tool.
Join @tapswap_bot
Collaboration - @taping_Guru
Last updated 11 months, 4 weeks ago
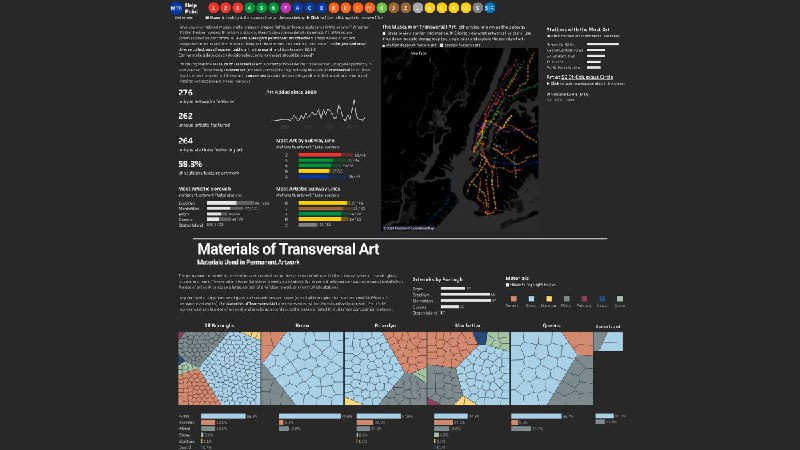
Featured on: 21-Nov-2024
Title: The Museum of Transversal Art
Description: Discover New York’s modern public art with Bianca Ng’s #VizOfTheDay. Recognized for "Most comprehensive view of the data" in the 2024 MTA Open Data Challenge, it maps subway artwork, locations, authors, and more.
Author: Bianca Ng
Link to dashboard: https://public.tableau.com/app/profile/bianca.ng/viz/MuseumofTransversalArtMTA2024OpenDataChallengePermanentArtCatalog/TheMuseumofTransversalArt
Credits: Tableau Viz of the Day
-----------------------------------
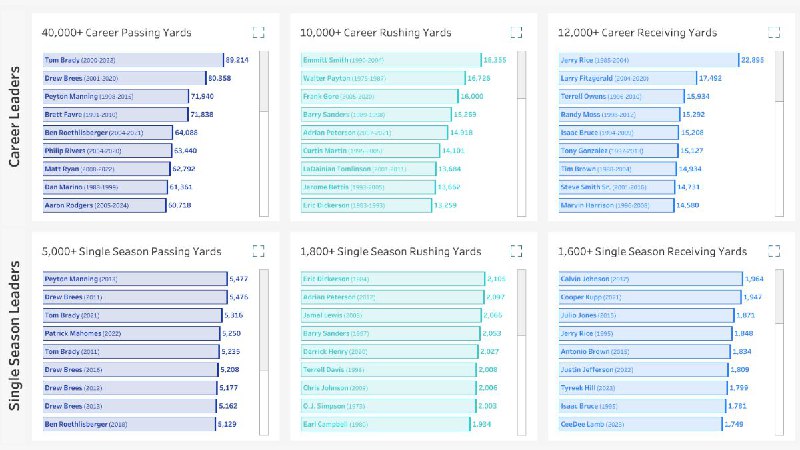
Featured on: 19-Nov-2024
Title: Football Leaders and Dynamic Zone Zooming
Description: Using dynamic zone zooming, Jeff Plattner’s #VizOfTheDay brings football stats into focus. Explore standout players in passing, rushing, and receiving with bar charts and scatter plots.
Author: Jeff Plattner
Link to dashboard: https://public.tableau.com/app/profile/jeff.plattner4532/viz/NFLLeadersandDynamicZoneZooming/NFLLeaders
Credits: Tableau Viz of the Day
-----------------------------------
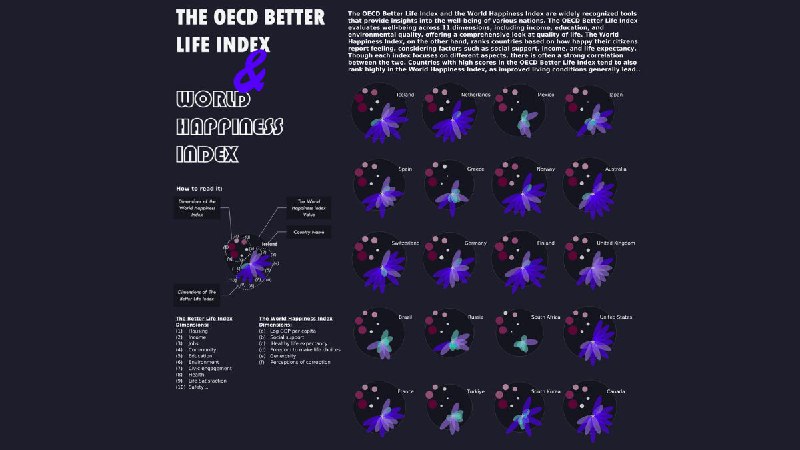
Featured on: 18-Nov-2024
Title: The OECD Better Life Index and World Happiness Index (2024)
Description: This #VizOfTheDay by Devi Arnita uses a petal circle chart to compare the World Happiness Index and OECD Better Life Index for 20 countries, highlighting their relationship. Explore this viz inspired by CJ Mayes.
Author: Devi Arnita
Link to dashboard: https://public.tableau.com/app/profile/devi.arnita/viz/PetalCirclestanpaMapLayerhuhuNEWPUBLIC4/DashboardFINAL
Credits: Tableau Viz of the Day
-----------------------------------

Featured on: 14-Nov-2024
Title: Most Reliable Car Brands in the US
Description: Tableau Visionary Chimdi Nwosu uses a beeswarm chart to visualize the most reliable car brands in the US in this #VizOfTheDay. This #MakeoverMonday was created using Andy Kriebel’s beeswarm calculation.
Author: Chimdi Nwosu
Link to dashboard: https://public.tableau.com/app/profile/chimdi.nwosu/viz/MakeoverMondayWk43-TheMostReliableCarBrandsintheUS/Dashboard1
Credits: Tableau Viz of the Day
-----------------------------------

Featured on: 13-Nov-2024
Title: Solar Energy Performance Dashboard
Description: Get optimized power generation insights. This #VizOfTheDay by Sebastine Amede uses radar heatmaps, bar charts, and more to show real-time and seasonal solar trends. Explore this Real World Fake Data #RWFD entry.
Author: Sebastine Amede
Link to dashboard: https://public.tableau.com/app/profile/sebastine/viz/Book2_17304711681820/Dashboard1
Credits: Tableau Viz of the Day
-----------------------------------

Featured on: 12-Nov-2024
Title: Commonwealth Games
Description: This #VizOfTheDay by Abbie Taylor uses a radial diagram to showcase the sports included in each Commonwealth Games edition since 1930. Explore this #SportsVizSunday entry.
Author: Abbie Taylor
Link to dashboard: https://public.tableau.com/app/profile/abbietaylor1/viz/CommonwealthGames_17298463054830/CommonwealthGames
Credits: Tableau Viz of the Day
-----------------------------------
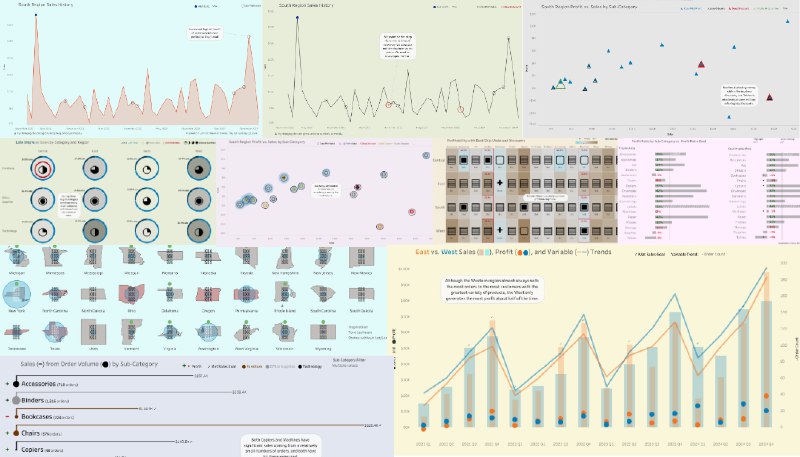
Featured on: 08-Nov-2024
Title: Quadruple-Axis Charts
Description: Explore 10 techniques for creating quadruple-axis charts with Ray Givler's #VizOfTheDay. Leverage mark label text to layer more insights.
Author: Ray Givler
Link to dashboard: https://public.tableau.com/app/profile/ray3296/viz/10WaystoMakeQuadruple-AxisCharts/QuadCharts
Credits: Tableau Viz of the Day
-----------------------------------
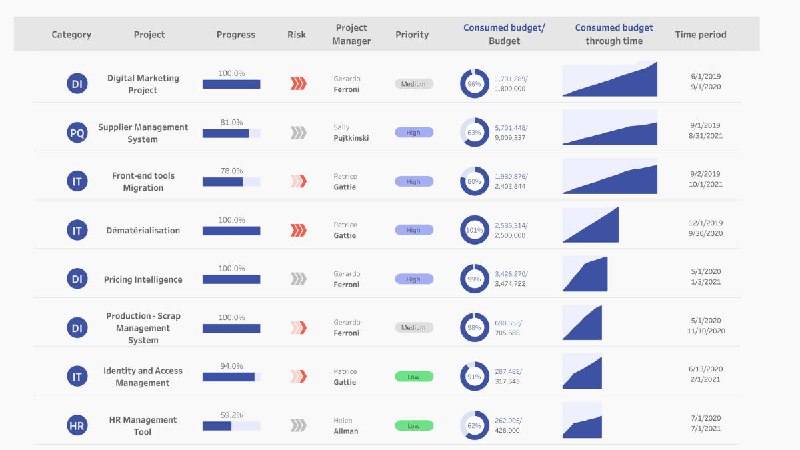
Featured on: 07-Nov-2024
Title: Project Management
Description: Visualize project management using tables with map layers. Nhung Le visualizes timelines and metrics in one view with this #VizOfTheDay. Explore the details in this viz from the Real World Fake Data community-led project.
Author: Nhung Le
Link to dashboard: https://public.tableau.com/app/profile/le.nhung/viz/ProjectManagementTablewithMapLayer/ProjectManagementDashboard
Credits: Tableau Viz of the Day
-----------------------------------
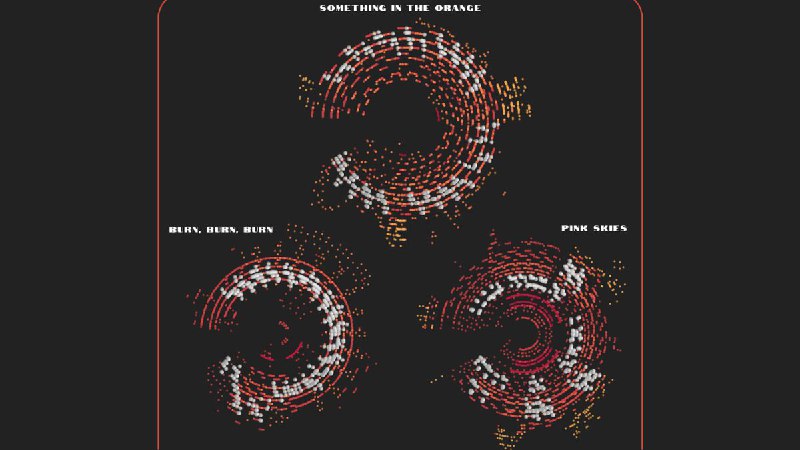
Featured on: 01-Nov-2024
Title: Zach Bryan
Description: Get into the rhythm of Zach Bryan’s music. This #VizOfTheDay by Tableau Visionary Lindsay Betzendahl blends MIDI files, Whitney Wood’s data prep, and Sam Epley’s inspiration. #DataPlusMusic.
Author: Lindsay Betzendahl
Link to dashboard: https://public.tableau.com/app/profile/lindsay.betzendahl/viz/ZachBryan/ZachBryan
Credits: Tableau Viz of the Day
-----------------------------------
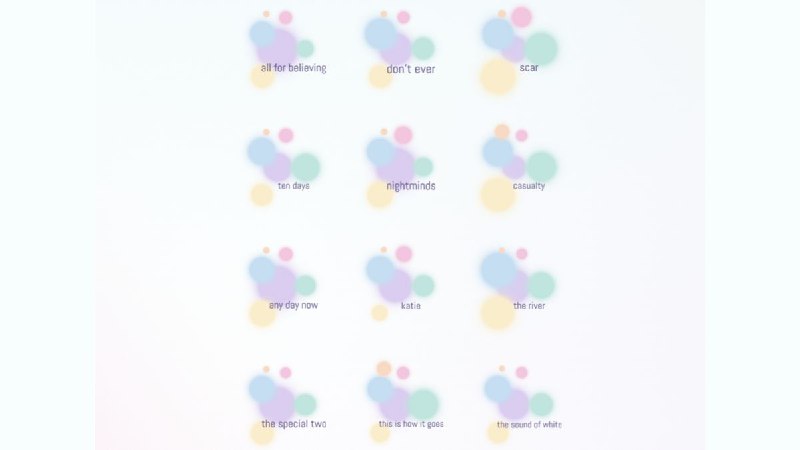
Featured on: 31-Oct-2024
Title: 20 Years On: A Visual Celebration to an Iconic Album
Description: This #VizOfTheDay by Kimly Scott visualizes track attributes of Australian singer-songwriter Missy Higgins' The Sound of White album. Striking a chord, 20 years on. A #DataPlusMusic viz ?
Author: Kimly Scott
Link to dashboard: https://public.tableau.com/app/profile/kimly.scott/viz/TheSoundOfWhite20thAnniversary/TheSoundOfWhite20thAnniversary
Credits: Tableau Viz of the Day
-----------------------------------
Community chat: https://t.me/hamster_kombat_chat_2
Website: https://hamster.network
Twitter: x.com/hamster_kombat
YouTube: https://www.youtube.com/@HamsterKombat_Official
Bot: https://t.me/hamster_kombat_bot
Last updated 11 months, 1 week ago
Your easy, fun crypto trading app for buying and trading any crypto on the market.
📱 App: @Blum
🤖 Trading Bot: @BlumCryptoTradingBot
🆘 Help: @BlumSupport
💬 Chat: @BlumCrypto_Chat
Last updated 1 year, 4 months ago
Turn your endless taps into a financial tool.
Join @tapswap_bot
Collaboration - @taping_Guru
Last updated 11 months, 4 weeks ago