FXOpen official

🌍 FCA & CySEC Regulated
💰 700+ instruments, spreads from 0.0 pips
📊 Join for exclusive analytics & news!
💬 Our chat @fxo_chat
🔗 https://linktr.ee/fxopen

Community chat: https://t.me/hamster_kombat_chat_2
Website: https://hamster.network
Twitter: x.com/hamster_kombat
YouTube: https://www.youtube.com/@HamsterKombat_Official
Bot: https://t.me/hamster_kombat_bot
Last updated 1 year ago

Your easy, fun crypto trading app for buying and trading any crypto on the market.
📱 App: @Blum
🤖 Trading Bot: @BlumCryptoTradingBot
🆘 Help: @BlumSupport
💬 Chat: @BlumCrypto_Chat
Last updated 1 year, 5 months ago

Turn your endless taps into a financial tool.
Join @tapswap_bot
Collaboration - @taping_Guru
Last updated 1 year ago
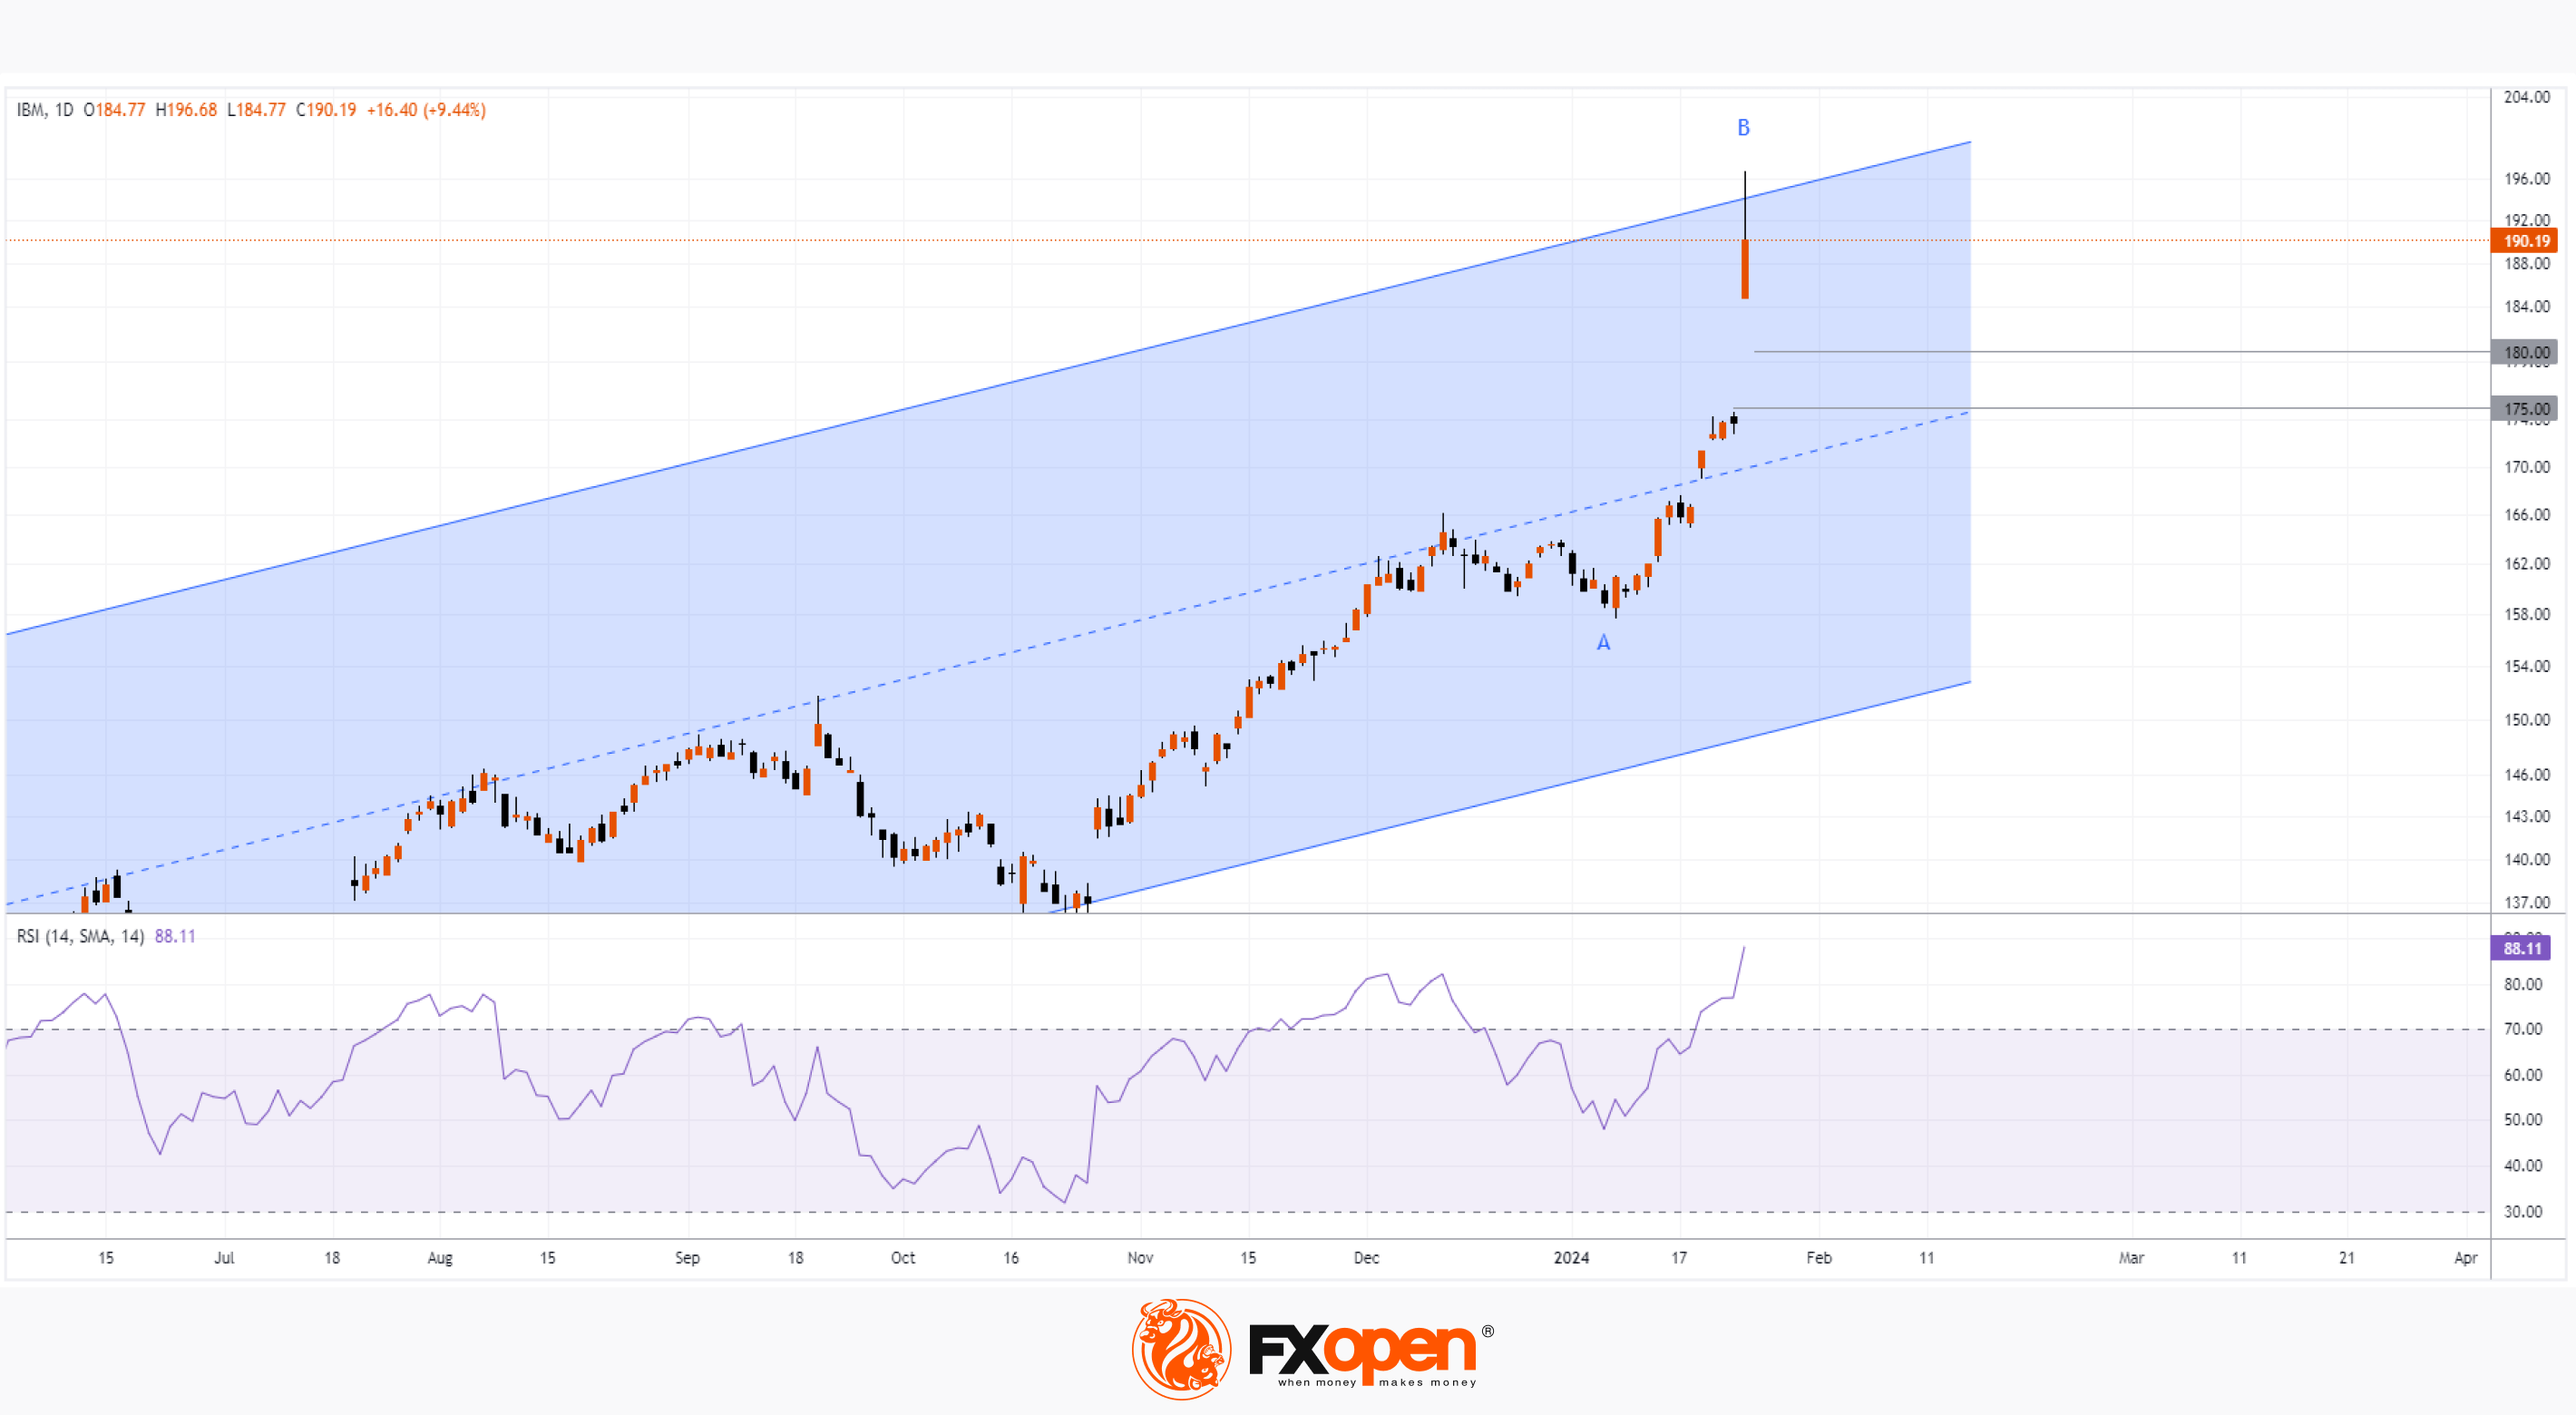
#stockmarket #stocks #MarketNews #IBM IBM Share Price Soars Nearly 10%
As the chart shows, the closing price on January 24 = USD 173.79, closing price on January 25 = USD 190.19. At yesterday's peak, IBM's share price was above USD 196, helped by a strong fourth-quarter earnings report that was positive about the company's prospects due to advances in AI.
→ Total revenue was USD 17.381 billion, compared to USD 16.690 billion in the prior-year quarter.
→ The acquisition of Red Hat made IBM the fifth-largest cloud service provider by market share. This is very important given the industry's projected growth rate of 16% per year until 2028.
→ Advances in quantum computing, exemplified by the release of the 127-qubit Eagle quantum chip.
In addition, the company has increased dividends for 28 years in a row, making IBM shares attractive to a wide range of investors.
Technical analysis of the IBM stock price chart shows that:
→ the price has reached the upper border of the parallel channel (shown in blue);
→ the RSI indicator indicates strong overbought;
→ a long upper shadow formed on yesterday’s candle – a sign of sales activity. It is acceptable to assume that some investors rushed to take profits in order to later find an opportunity to re-enter a long position at lower prices.
Indeed, given the chart situation, IBM's share price is vulnerable to a pullback following the extremely positive report. If a pullback occurs, the price may find support in the area between the psychological levels of USD 175 and USD 180 per share of IBM, where the 50% Fibonacci level of the upward impulse A→B passes. The channel median line can also help the bulls.
Buy or sell shares with CFDs in some of the world's biggest publicly listed companies on FXOpen’s trading platform.Open your FXOpen account now or learn more about trading share CFDs with FXOpen.
CFDs are complex instruments and come with a high risk of losing your money.
This article represents the opinion of the Companies operating under the FXOpen brand only. It is not to be construed as an offer, solicitation, or recommendation with respect to products and services provided by the Companies operating under the FXOpen brand, nor is it to be considered financial advice.
[#stockmarket](?q=%23stockmarket) [#stocks](?q=%23stocks) [#MarketNews](?q=%23MarketNews) [#IBM](?q=%23IBM) **IBM Share Price Soars Nearly 10%**](/media/attachments/fxo/fxopen_official/2001.jpg)
#marketanalysis #XAUUSD #goldprice The Price of Gold (XAU/USD) Has Descended to a Significant Support Level
The beginning of 2024 has not been the most positive for gold investors, despite a promising December 2023 when XAU/USD prices reached a historical high of $2135.39 per ounce, primarily due to a weak US dollar and expectations that the Federal Reserve (Fed) would begin lowering interest rates.
However, from the first trading day of January, the price of gold (XAU/USD) has fallen from around $2061 to current levels of around $2015 per ounce (a decrease of 2.3%). This is somewhat surprising considering that gold has a reputation as a defensive asset, and geopolitical tensions persist. Perhaps the price is undergoing a correction after reaching a historical high, pulling back from overbought conditions (evident from the RSI indicator).
The XAU/USD gold chart indicates that:
→ the price has descended to the psychological level of $2000 per ounce, which already showed support on January 17th;
→ the price is also near an important trendline (indicated by the thickened blue line), from which support can be expected;
→ the price is forming a consolidation pattern between the thickened red and blue lines.
What's next?
JPMorgan analysts believe that in 2024, the price of gold (XAU/USD) will reach $2300 as the US GDP growth slows down and the Fed reduces interest rates. However, they suggest that this is likely to happen in the second half of the year, and in the first half, a decline is more probable, increasing the likelihood of a bearish breakout from the current consolidation pattern.
Start trading commodities with tight spreads. Open your trading account now or learn more about trading commodity CFDs with FXOpen.
CFDs are complex instruments and come with a high risk of losing your money.
This article represents the opinion of the Companies operating under the FXOpen brand only. It is not to be construed as an offer, solicitation, or recommendation with respect to products and services provided by the Companies operating under the FXOpen brand, nor is it to be considered financial advice.
[#marketanalysis](?q=%23marketanalysis) [#XAUUSD](?q=%23XAUUSD) [#goldprice](?q=%23goldprice) **The Price of Gold (XAU/USD) Has Descended to a Significant Support Level**](/media/attachments/fxo/fxopen_official/2000.jpg)
#marketanalysis #tsla #stockmarket #stocks The Share Price of TSLA Sharply Declined After the Release of the Report
Following the publication of Tesla's (ticker TSLA) financial results for the fourth quarter of 2023, the company's stock price dropped. The TSLA share price in pre-market trading today is around $195, compared to yesterday's closing price of over $207 (approximately -6%).
Reasons for disappointment:
→ Earnings per share fell short of expectations at $0.71, compared to the Wall Street consensus of $0.73 per share.
→ Quarterly revenue amounted to $25.167 billion, which also fell below the expected $25.640 billion.
→ Additionally, a decrease in profitability was reported, partly attributed to issues with the introduction of the Cybertruck.
→ Tesla also provided a cautious outlook for 2024, warning that the growth rate in car production volumes could be "significantly lower" than in 2023. This is primarily due to the focus on launching the next-generation vehicle at the Gigafactory in Texas.
In October 2023, analysing the TSLA stock chart, it was noted that the price broke below the ascending trend. How does the situation look today?
→ The TSLA price failed to return to the ascending trend (shown in blue) of 2023.
→ The price continues to evolve within the descending trend (shown in red), the contours of which were noticeable as early as October.
After the release of this news, a bearish gap is likely to form at today's opening, and one should be prepared for:
→ Breaking the psychological level of $200 per share – this level may switch its role from support (noticeable in the price action on October 30-31) to resistance.
→ The TSLA share price dropping to the lower half of the descending channel. The median line of this channel will act as resistance.
→ Bears attempting to extend their success to bring the price down to the lower boundary of the channel (around $180).
Investor issues with TSLA stock have been evident for some time, as the price has been noticeably weaker than stock indices reaching peaks in December 2023 - January 2024. If the fundamental backdrop continues to be negative, it is possible that the red descending channel will shape the trajectory of TSLA's price in the first half of 2024.
Buy or sell shares with CFDs in some of the world's biggest publicly listed companies on FXOpen’s trading platform. Open your FXOpen account now or learn more about trading share CFDs with FXOpen.
[#marketanalysis](?q=%23marketanalysis) [#tsla](?q=%23tsla) [#stockmarket](?q=%23stockmarket) [#stocks](?q=%23stocks) **The Share Price of TSLA Sharply Declined After the Release of the Report**](/media/attachments/fxo/fxopen_official/1999.jpg)
#inflation #stockmarket #AAPL #MSFT #usdollar #OPEC Weekly Market Wrap with Gary Thomson: UK100 DROPS 1.5%, USD RISES, OPEC’S FORECASTS, MICROSOFT SURPASSES APPLE
Get the latest scoop on the week's hottest headlines, all in one convenient video. Join Gary Thomson, the COO of FXOpen UK, as he breaks down the most significant news reports and shares his expert insights.
? The UK100 Price Plummeted After the Publication of Inflation Data
?The Dollar Continues to Strengthen since the Beginning of the Year
? OPEC Forecasts an Increase in Oil Demand in 2024
? Microsoft Becomes the Most Expensive Company in the World, Surpassing Apple
Stay in the know and empower yourself with our short, yet power-packed video. Watch it now and stay updated with FXOpen. Don't miss out on this invaluable opportunity to sharpen your trading skills and make informed decisions.
CFDs are complex instruments and come with a high risk of losing money rapidly due to leverage. 65.68% of retail investor accounts lose money when trading CFDs with this provider. You should consider whether you understand how CFDs work, and whether you can afford to take the high risk of losing your money.
To take advantage of price fluctuations in the foreign exchange markets, consider enlisting the services of a reliable broker like FXOpen.
⚠️
This forecast represents FXOpen Companies opinion only, it should not be construed as an offer, invitation or recommendation in respect to FXOpen Companies products and services or as financial advice
YouTube
Weekly Market Wrap with Gary Thomson: UK100 DROPS 1.5%, USD RISES, OPEC’S FORECASTS, MSFT GROWS
Get the latest scoop on the week's hottest headlines, all in one convenient video. Join Gary Thomson, the COO of FXOpen UK, as he breaks down the most significant news reports and shares his expert insights. - The UK100 Price Plummeted After the Publication…
 [#stockmarket](?q=%23stockmarket) [#AAPL](?q=%23AAPL) [#MSFT](?q=%23MSFT) [#usdollar](?q=%23usdollar) [#OPEC](?q=%23OPEC) **Weekly Market Wrap with Gary Thomson: UK100 DROPS 1.5%, USD RISES, OPEC’S FORECASTS, MICROSOFT …](/media/attachments/fxo/fxopen_official/1994.jpg)
#stockmarket #Nasdaq #marketnews
NASDAQ 100 Reaches Historic High. META Shares May Surpass the Historical High
The American stock index NASDAQ 100 has set a new historical high, surpassing the psychological mark of 17,000 points.
The growth was attributed to:
→ Analysts at Bank of America raising the rating of AAPL stocks, recommending them for BUY. The price of AAPL shares rose by almost 4%.
→ The growth of AMD and NVDA stock prices, as chip manufacturers are significant beneficiaries due to the widespread adoption of AI.
→ The earnings season gaining momentum. Market participants anticipate strong results from major technology companies (MSFT, GOOGL, NVDA, and others).
Note the movement of META stock price – the social media giant is close to reclaiming a $1 trillion market capitalisation.
The META stock price chart shows that:
→ The market is in an upward trend (indicated by the blue channel). The price is above the median line, a sign of demand stability.
→ The level at $340 has shifted its role from resistance to support. A similar phenomenon is observed at the $360 level.
Mark Zuckerberg announced yesterday that by the end of 2024, the company's computing infrastructure would include 350,000 nVidia H100 graphics cards (designed for AI, costing between $25k and $40k each, according to CNBC).
It is not ruled out that riding on the positive momentum, the price of META shares may surpass the historical high. The publication of META's Q4 2023 performance report is scheduled for February 1, 2024.
Buy or sell shares with CFDs in some of the world's biggest publicly listed companies on FXOpen’s trading platform. Open your FXOpen account now or learn more about trading share CFDs with FXOpen.
CFDs are complex instruments and come with a high risk of losing money rapidly due to leverage. 65.68% of retail investor accounts lose money when trading CFDs with this provider.
This article represents the opinion of the Companies operating under the FXOpen brand only. It is not to be construed as an offer, solicitation, or recommendation with respect to products and services provided by the Companies operating under the FXOpen brand, nor is it to be considered financial advice.
 [#Nasdaq](?q=%23Nasdaq) [#marketnews](?q=%23marketnews)](/media/attachments/fxo/fxopen_official/1993.jpg)
#marketanalysis #stockmarket #stocks The UK100 price plummeted after the publication of inflation data
Yesterday, the stock market in the United Kingdom experienced a sharp decline following the release of new inflation data. The UK100 price, reflecting the leading British stock index FTSE, dropped approximately 1.5%. Moreover, the RSI indicator on the 4-hour chart fell below the value of 18 for the first time since July 2023.
Analysts attribute this decline to the published inflation data, which not only failed to meet economists' expectations but also indicated a possible strengthening of inflationary pressure in the country. CPI values: actual = 4.0%, expected = 3.8%, previous value = 3.9%.
This raised concerns among investors regarding the Bank of England's future steps in managing interest rates and the potential slowdown in the country's economic growth.
Sectors most sensitive to changes in interest rates, such as real estate and finance, showed the greatest decline. Significant decreases were also observed in the stocks of companies in the retail and consumer goods sectors, reflecting growing concerns about consumer confidence and spending.
The UK100 chart shows that:
→ the price dropped to the lower boundary of the channel, indicated in blue;
→ market weakness could be inferred from the inability of the UK100 price to stay above the September maximum in December, as well as price action around the 7665 level, which switched roles from support to resistance.
If new negative news emerges for the stock market, support from the lower boundary of the channel may be breached. In that case, it is not excluded that the UK100 stock index will decline to the level of 7300, which served as strong support throughout 2023.
Trade global indices with zero commission and tight spreads with FXOpen. Open your account now or learn more about trading index CFDs with FXOpen.
CFDs are complex instruments and come with a high risk of losing your money.
This article represents the opinion of the Companies operating under the FXOpen brand only. It is not to be construed as an offer, solicitation, or recommendation with respect to products and services provided by the Companies operating under the FXOpen brand, nor is it to be considered financial advice.
#marketanalysis #stockmarket #nvidia #oilprices
Weekly Market Wrap With Gary Thomson: NASDAQ’S NEW TOP OF THE YEAR, USD/CAD NEWS, WTI OIL, NVDA SHARES DECLINE
Get the latest scoop on the week's hottest headlines, all in one convenient video. Join Gary Thomson, the COO of FXOpen UK, as he breaks down the most significant news reports and shares his expert insights.
?NASDAQ: New Top of the Year
?USD/CAD: The Rate Approaching Important Support
?The Price of WTI Oil Forming a Reversal Pattern
?NVDA shares decline after strong report
Stay in the know and empower yourself with our short, yet power-packed video. Watch it now and stay updated with FXOpen.
Don't miss out on this invaluable opportunity to sharpen your trading skills and make informed decisions.
To take advantage of price fluctuations in the foreign exchange markets, consider enlisting the services of a reliable broker like FXOpen.
⚠️
This forecast represents FXOpen Companies opinion only, it should not be construed as an offer, invitation or recommendation in respect to FXOpen Companies products and services or as financial advice
YouTube
Weekly Market Wrap With Gary Thomson: NASDAQ’S NEW TOP, USD/CAD NEWS, WTI OIL, NVDA SHARES DECLINE
Get the latest scoop on the week's hottest headlines, all in one convenient video. Join Gary Thomson, the COO of FXOpen UK, as he breaks down the most significant news reports and shares his expert insights. NASDAQ: New Top of the Year #NASDAQ USD/CAD: The…
 [#stockmarket](?q=%23stockmarket) [#nvidia](?q=%23nvidia) [#oilprices](?q=%23oilprices)](/media/attachments/fxo/fxopen_official/1937.jpg)
#marketanalysis #MarketNews #crypto
AVAX Analysis: Market in Vulnerable Position
A chart from the FXOpen Ticktrader platform shows that the AVAX/USD cryptocurrency rate showed strong growth: in the month from October 20 to November 20, the price increased by more than 150%.
This happened against the backdrop of:
→ general positivity in the cryptocurrency market associated with the expectation of approval of Bitcoin ETFs by the SEC regulator;
→ the news about investments in the Avalance ecosystem, the native token of which is AVAX.
However, the chart also shows important signs that the market may be vulnerable to a pullback. Namely:
→ rapid growth stalled in the period from November 16 to 19. Perhaps too many investors wanted to join a pronounced trend, but did so too late: these are prerequisites typical for a correction to occur;
→ the price has exceeded the level of the previous high of the year, but there are long upper shadows on the candles, and the closes are below the high level - these are signs of a false breakout.
On November 22, the price bounced up from the broken line of the descending channel, which can be regarded as a bullish signal. But the described signs of weakness look too convincing, forcing us to consider the return of the AVAX price inside the downward channel as a realistic option.
To benefit from the rise and fall of cryptocurrency prices, consider enlisting the services of a trusted broker like FXOpen.
CFDs are complex instruments and come with a high risk of losing your money.
This article represents the opinion of the Companies operating under the FXOpen brand only. It is not to be construed as an offer, solicitation, or recommendation with respect to products and services provided by the Companies operating under the FXOpen brand, nor is it to be considered financial advice.
At FXOpen UK and FXOpen AU, Cryptocurrency CFDs are only available for trading by those clients categorised as Professional clients under FCA Rules and Professional clients under ASIC Rules, respectively. They are not available for trading by Retail clients.
#marketanalysis #MarketNews #stockmarket
Market Analysis: European Shares Rise on Improving PMI Readings
Yesterday, the values of the PMI index (it is characterized as a leading indicator of industrial production and services) for European countries were published:
→ in Germany: fact = 42.3; expected = 41.1; a month earlier = 40.7;
→ in France: fact = 42.6; expected = 43.2; a month earlier = 42.6;
Although the index values are below 50, indicating a contraction in the economy, the dynamics are encouraging. Thus, in France, the index stabilized after a series of declines. And in Germany, the index is consistently growing after a minimum of 38.8 in July. In this way, business is reacting to the fact that the ECB may have reached the peak of increases and monetary policy will not tighten in the future.
At the same time, the ESX50 index of 50 European shares gained bullish momentum and reached its highest levels since mid-August. Equity market participants may be feeling strongly positive about the rally of more than +9% in less than a month.
However, the daily chart of the ESX50 shows that price dynamics allow a structure of trend lines (shown in blue) to be drawn, reminiscent of a Gann fan. And what's interesting is that the current value has reached an important line (shown as thickening) in this structure, which can serve as resistance - as it did more than once during the period from April to July.
Given that the RSI indicator is forming divergence in the overbought zone, it can be assumed that the market is vulnerable to a pullback.
To benefit from fluctuations in European stock markets, consider enlisting the services of a trusted broker like FXOpen.
CFDs are complex instruments and come with a high risk of losing your money.
This article represents the opinion of the Companies operating under the FXOpen brand only. It is not to be construed as an offer, solicitation, or recommendation with respect to products and services provided by the Companies operating under the FXOpen brand, nor is it to be considered financial advice.
[#marketanalysis](?q=%23marketanalysis) [#MarketNews](?q=%23MarketNews) [#stockmarket](?q=%23stockmarket)](/media/attachments/fxo/fxopen_official/1935.jpg)
#inflation #MarketNews #sp500 #stockmarket #oilprices
Weekly Market Wrap With Gary Thomson: EUR/GBP’s NEW HIGH, US INFLATION NEWS, S&P 500 FORECASTS, BRENT CRUDE
Get the latest scoop on the week's hottest headlines, all in one convenient video. Join Gary Thomson, the COO of FXOpen UK, as he breaks down the most significant news reports and shares his expert insights.
? EUR/GBP: Price Reaches 6-month High
? Important News on US Inflation Rock Financial Markets
? Morgan Stanley Analysts Raise Forecasts for S&P 500
? Citi Analysts Expect Brent to Reach $73 in 2024
Stay in the know and empower yourself with our short, yet power-packed video. Watch it now and stay updated with FXOpen.
Don't miss out on this invaluable opportunity to sharpen your trading skills and make informed decisions.
To take advantage of price fluctuations in the foreign exchange markets, consider enlisting the services of a reliable broker like FXOpen.
⚠️
This forecast represents FXOpen Companies opinion only, it should not be construed as an offer, invitation or recommendation in respect to FXOpen Companies products and services or as financial advice.
YouTube
Weekly Market Wrap With Gary Thomson: EUR/GBP’s NEW HIGH, US INFLATION, S&P500 FORECAST, BRENT CRUDE
Get the latest scoop on the week's hottest headlines, all in one convenient video. Join Gary Thomson, the COO of FXOpen UK, as he breaks down the most significant news reports and shares his expert insights. - EUR/GBP: Price Reaches 6-month High #EURGBP…
 [#MarketNews](?q=%23MarketNews) [#sp500](?q=%23sp500) [#stockmarket](?q=%23stockmarket) [#oilprices](?q=%23oilprices)](/media/attachments/fxo/fxopen_official/1927.jpg)
Community chat: https://t.me/hamster_kombat_chat_2
Website: https://hamster.network
Twitter: x.com/hamster_kombat
YouTube: https://www.youtube.com/@HamsterKombat_Official
Bot: https://t.me/hamster_kombat_bot
Last updated 1 year ago
Your easy, fun crypto trading app for buying and trading any crypto on the market.
📱 App: @Blum
🤖 Trading Bot: @BlumCryptoTradingBot
🆘 Help: @BlumSupport
💬 Chat: @BlumCrypto_Chat
Last updated 1 year, 5 months ago
Turn your endless taps into a financial tool.
Join @tapswap_bot
Collaboration - @taping_Guru
Last updated 1 year ago